Implied Volatility (IV) Surface: Key Concepts for Beginning Options Traders

Understanding the Implied Volatility Surface: A Key to Choosing the Right Strike Prices and Expirations in Options Trading
When it comes to options trading, particularly with equity index options like SPY (S&P 500 ETF) or QQQ (NASDAQ-100 ETF), understanding the nuances of implied volatility (IV) can greatly enhance your ability to select optimal strike prices and expirations. One of the most critical concepts in this context is the Implied Volatility Surface—a three-dimensional representation that captures how IV varies across different strike prices and expiration dates. For individual traders focusing on strategies like Buying Calls or Buying Puts, this understanding can be a game-changer.
What is the Implied Volatility Surface?
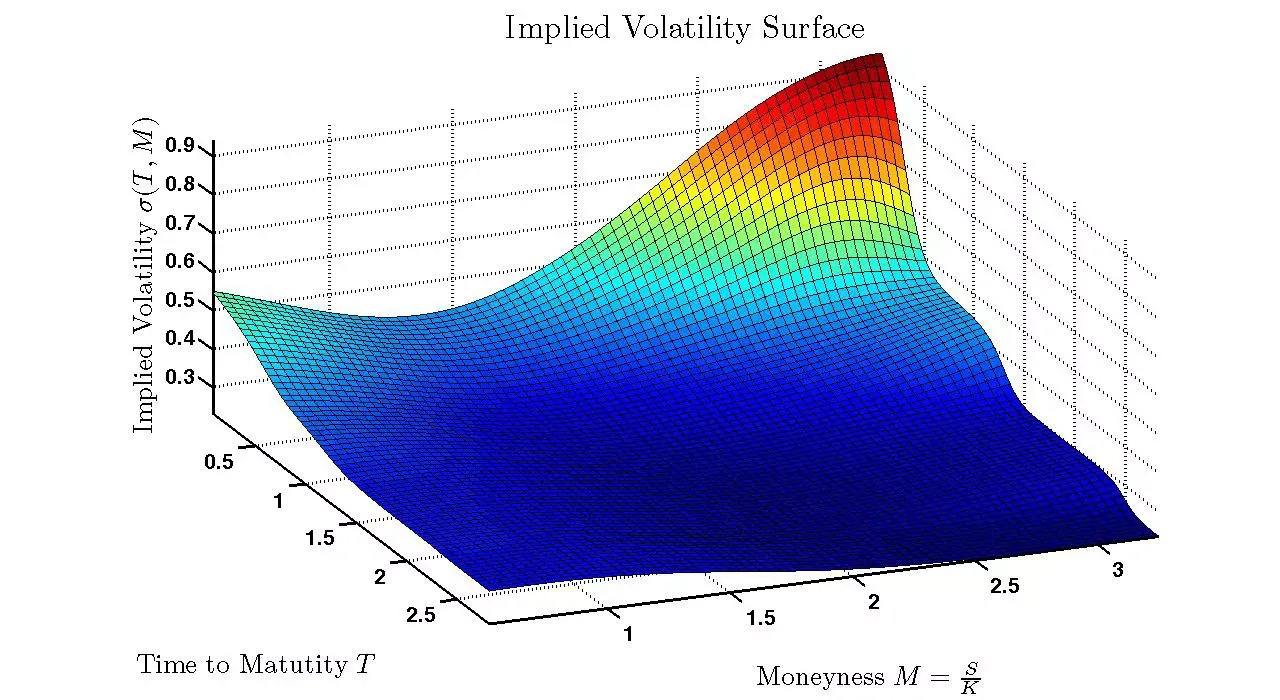
The implied volatility surface is essentially a plot that illustrates how IV changes depending on the strike price (horizontal axis) and the time to expiration (depth axis). The height or vertical axis represents the IV itself. Unlike what the Black-Scholes model might suggest, the volatility surface is rarely flat. Instead, it often exhibits a curve, or "smile," especially in real-world market conditions. This curvature reflects market sentiments, supply and demand, and the perceived risk of the underlying asset at different price levels and times.
For example, in many equity indices, you'll often see that options with lower strike prices (out-of-the-money puts) have higher implied volatilities than higher strike prices (out-of-the-money calls). This phenomenon, known as volatility skew, is primarily due to the demand for downside protection—investors tend to buy puts as insurance against a market decline, pushing up their prices and, consequently, their implied volatilities.
The persistent demand for downside protection can have an outsided impact on volatility skew, pushing prices for put-buyers higher.
Why Does the Volatility Surface Matter?
Understanding the volatility surface is crucial for traders because it provides insight into market expectations. If you're buying a call option, you might be interested in how IV behaves as the market rises. Conversely, if you're buying a put, understanding how IV behaves as the market falls is essential.
For instance, if you notice that the IV for a particular strike price is significantly higher than for other strikes, this could indicate heightened market expectations of large price movements at that level—possibly due to upcoming economic events or earnings reports. This skew can make certain options more expensive, which may affect your decision on whether to enter a trade or not.
Examples of How to Use the Volatility Surface
Imagine you're considering buying a call option on SPY. The current market price is $450, and you’re eyeing a $460 strike price. Looking at the volatility surface, you observe that the IV for this strike price is relatively low compared to other strike prices. This might indicate that the market is not expecting significant price movement in this range, making the option cheaper but also implying that the potential for profit is lower unless the market surprises to the upside.
On the other hand, if you were buying a put at a $440 strike price, you might notice a higher IV. This could suggest that the market is nervous about a potential drop below this level, which might make the option more expensive but also could offer a higher payoff if the market does indeed fall.
The Role of Volatility Skew and Term Structure
Volatility skew—the difference in IV across different strike prices—can indicate where market participants believe the risk lies. In the case of equity index options, skew is often to the downside, meaning out-of-the-money puts are more expensive than out-of-the-money calls. This is largely because investors typically seek protection against market drops, driving up the price (and IV) of puts.
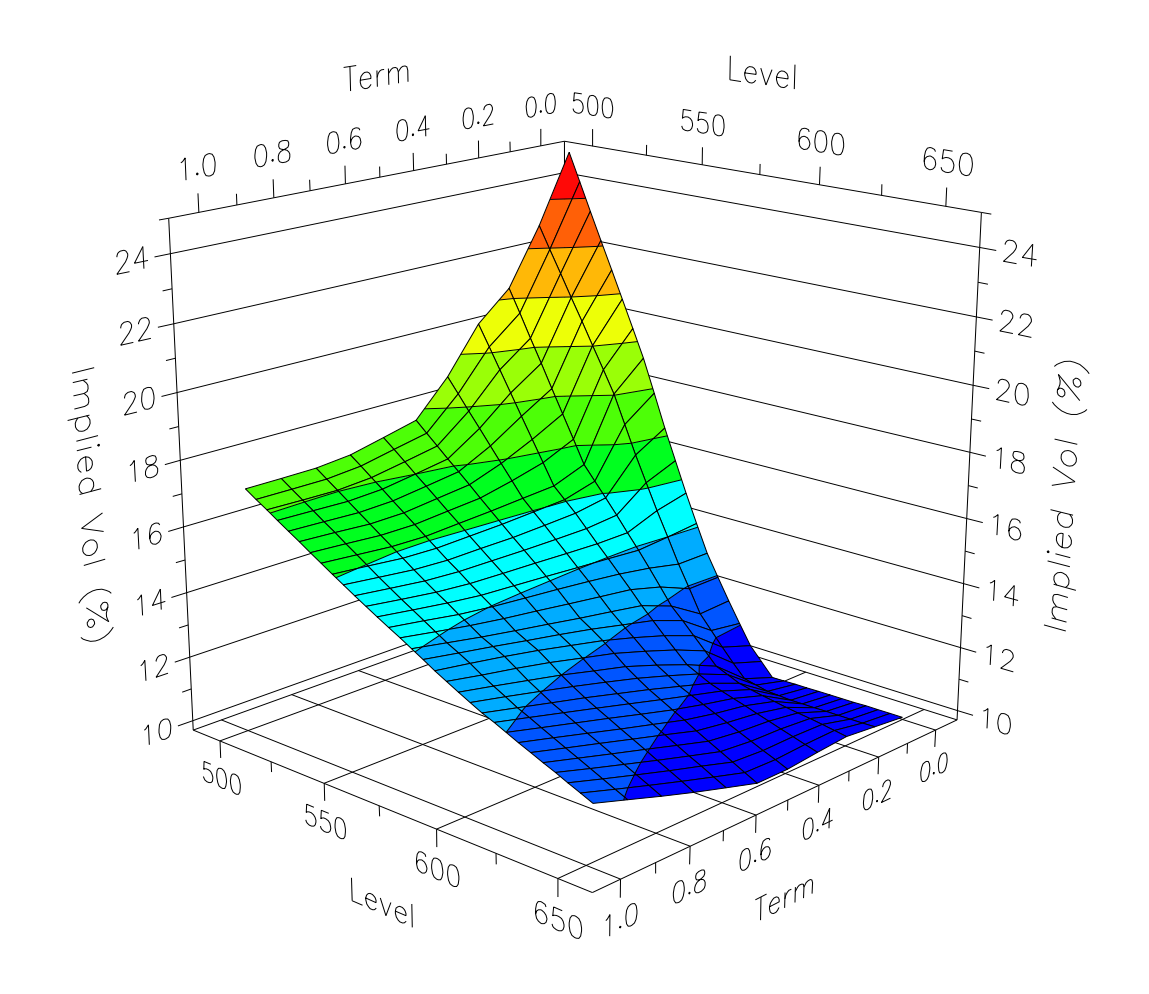
Term structure, another aspect of the volatility surface, reflects how IV changes with the time to expiration. Generally, long-dated options tend to have higher IVs than short-dated ones, reflecting the increased uncertainty over a longer period. However, this isn’t always the case, especially if a significant event (like an earnings report or a central bank meeting) is expected soon.
Practical Application: The Rule of 16
The Rule of 16 can help traders translate the VIX, or any IV measure, into expected daily market moves. For example, if the VIX (which reflects the IV of S&P 500 options) is at 16, this suggests an expected daily move of about 1% (since 16/16 = 1). If the VIX is at 24, the daily moves might be expected to be around 1.5%. And at 32, the rule of 16 says the SPX might see 2% daily moves.
Understanding this can help you gauge whether the options you're considering are priced fairly given your expectations for market movement.
Conclusion
For options traders, especially those focusing on buying calls and puts, mastering the concept of the implied volatility surface is essential. It provides a deeper understanding of market sentiment and helps you make more informed decisions about which strike prices and expiration dates to choose. By integrating this knowledge with practical tools like the Rule of 16 and recognizing volatility skew, you can significantly enhance your trading strategy and potentially increase your returns.
Sources
- The Volatility Surface Explained, by Craig Anthony: https://www.investopedia.com/articles/stock-analysis/081916/volatility-surface-explained.asp
- Quantitative Strategies, Research Notes, Goldman Sachs: The Local Volatility Surface: Unlocking the Information in Index Option Prices, by Emanuel Derman, Iraj Kani, Joseph Z. Zou, DEC 1995: https://emanuelderman.com/wp-content/uploads/1996/06/gs-local_volatility_surface.pdf
- Options Volatility: The VIX, Rule of 16, and Skew – Learn how to measure volatility using the Cboe VIX, rule of 16, and skew in your options trading, Schwab, FEB, 2023: https://www.schwab.com/learn/story/options-volatility-vix-skew-and-rule-16